
34. Chronos forecasting#
The paper behind this approach is here: https://arxiv.org/pdf/2403.07815 (univariate models)
The paper introduces Chronos, a framework that adapts language model architectures for time series forecasting. The key aspects are:
Approach:
Converts time series data into tokens through scaling and quantization
Uses existing transformer language model architectures with minimal modifications
Trains models on both real and synthetic time series data
Key Components:
TSMixup: Data augmentation technique that combines patterns from different time series
KernelSynth: Synthetic data generation using Gaussian processes
Based on T5 transformer architecture, with models ranging from 20M to 710M parameters
Main Results:
Significantly outperforms traditional statistical models and task-specific deep learning models on in-domain datasets
Achieves competitive zero-shot performance on unseen datasets compared to models specifically trained on those datasets
Fine-tuning further improves performance on new datasets
Key Benefits:
Eliminates need for task-specific training
Simplifies forecasting pipelines
Shows language model architectures can handle time series without specialized modifications
Provides strong zero-shot forecasting capabilities
Limitations:
Inference speed slower than some specialized models
Edge cases with very sparse or high-variance time series
Limited by available high-quality public time series data
The paper demonstrates that language model architectures can be effectively adapted for time series forecasting with minimal modifications, potentially simplifying real-world forecasting applications.
Chronos-2 was released in October 2025: https://www.amazon.science/blog/introducing-chronos-2-from-univariate-to-universal-forecasting. It now supports multivariate forecasting.
See Chronos: amazon-science/chronos-forecasting
Docs: https://auto.gluon.ai/stable/tutorials/timeseries/forecasting-chronos.html
%%time
!pip install chronos-forecasting
Collecting chronos-forecasting
  Downloading chronos_forecasting-2.0.1-py3-none-any.whl.metadata (23 kB)
Requirement already satisfied: accelerate<2,>=0.34 in /usr/local/lib/python3.12/dist-packages (from chronos-forecasting) (1.11.0)
Collecting boto3 (from chronos-forecasting)
  Downloading boto3-1.41.0-py3-none-any.whl.metadata (6.8 kB)
Requirement already satisfied: einops<1,>=0.7.0 in /usr/local/lib/python3.12/dist-packages (from chronos-forecasting) (0.8.1)
Requirement already satisfied: numpy<3,>=1.21 in /usr/local/lib/python3.12/dist-packages (from chronos-forecasting) (2.0.2)
Requirement already satisfied: scikit-learn<2,>=1.6.0 in /usr/local/lib/python3.12/dist-packages (from chronos-forecasting) (1.6.1)
Requirement already satisfied: torch<3,>=2.0 in /usr/local/lib/python3.12/dist-packages (from chronos-forecasting) (2.8.0+cu126)
Requirement already satisfied: transformers<5,>=4.41 in /usr/local/lib/python3.12/dist-packages (from chronos-forecasting) (4.57.1)
Requirement already satisfied: packaging>=20.0 in /usr/local/lib/python3.12/dist-packages (from accelerate<2,>=0.34->chronos-forecasting) (25.0)
Requirement already satisfied: psutil in /usr/local/lib/python3.12/dist-packages (from accelerate<2,>=0.34->chronos-forecasting) (5.9.5)
Requirement already satisfied: pyyaml in /usr/local/lib/python3.12/dist-packages (from accelerate<2,>=0.34->chronos-forecasting) (6.0.3)
Requirement already satisfied: huggingface_hub>=0.21.0 in /usr/local/lib/python3.12/dist-packages (from accelerate<2,>=0.34->chronos-forecasting) (0.36.0)
Requirement already satisfied: safetensors>=0.4.3 in /usr/local/lib/python3.12/dist-packages (from accelerate<2,>=0.34->chronos-forecasting) (0.6.2)
Requirement already satisfied: scipy>=1.6.0 in /usr/local/lib/python3.12/dist-packages (from scikit-learn<2,>=1.6.0->chronos-forecasting) (1.16.3)
Requirement already satisfied: joblib>=1.2.0 in /usr/local/lib/python3.12/dist-packages (from scikit-learn<2,>=1.6.0->chronos-forecasting) (1.5.2)
Requirement already satisfied: threadpoolctl>=3.1.0 in /usr/local/lib/python3.12/dist-packages (from scikit-learn<2,>=1.6.0->chronos-forecasting) (3.6.0)
Requirement already satisfied: filelock in /usr/local/lib/python3.12/dist-packages (from torch<3,>=2.0->chronos-forecasting) (3.20.0)
Requirement already satisfied: typing-extensions>=4.10.0 in /usr/local/lib/python3.12/dist-packages (from torch<3,>=2.0->chronos-forecasting) (4.15.0)
Requirement already satisfied: setuptools in /usr/local/lib/python3.12/dist-packages (from torch<3,>=2.0->chronos-forecasting) (75.2.0)
Requirement already satisfied: sympy>=1.13.3 in /usr/local/lib/python3.12/dist-packages (from torch<3,>=2.0->chronos-forecasting) (1.13.3)
Requirement already satisfied: networkx in /usr/local/lib/python3.12/dist-packages (from torch<3,>=2.0->chronos-forecasting) (3.5)
Requirement already satisfied: jinja2 in /usr/local/lib/python3.12/dist-packages (from torch<3,>=2.0->chronos-forecasting) (3.1.6)
Requirement already satisfied: fsspec in /usr/local/lib/python3.12/dist-packages (from torch<3,>=2.0->chronos-forecasting) (2025.3.0)
Requirement already satisfied: nvidia-cuda-nvrtc-cu12==12.6.77 in /usr/local/lib/python3.12/dist-packages (from torch<3,>=2.0->chronos-forecasting) (12.6.77)
Requirement already satisfied: nvidia-cuda-runtime-cu12==12.6.77 in /usr/local/lib/python3.12/dist-packages (from torch<3,>=2.0->chronos-forecasting) (12.6.77)
Requirement already satisfied: nvidia-cuda-cupti-cu12==12.6.80 in /usr/local/lib/python3.12/dist-packages (from torch<3,>=2.0->chronos-forecasting) (12.6.80)
Requirement already satisfied: nvidia-cudnn-cu12==9.10.2.21 in /usr/local/lib/python3.12/dist-packages (from torch<3,>=2.0->chronos-forecasting) (9.10.2.21)
Requirement already satisfied: nvidia-cublas-cu12==12.6.4.1 in /usr/local/lib/python3.12/dist-packages (from torch<3,>=2.0->chronos-forecasting) (12.6.4.1)
Requirement already satisfied: nvidia-cufft-cu12==11.3.0.4 in /usr/local/lib/python3.12/dist-packages (from torch<3,>=2.0->chronos-forecasting) (11.3.0.4)
Requirement already satisfied: nvidia-curand-cu12==10.3.7.77 in /usr/local/lib/python3.12/dist-packages (from torch<3,>=2.0->chronos-forecasting) (10.3.7.77)
Requirement already satisfied: nvidia-cusolver-cu12==11.7.1.2 in /usr/local/lib/python3.12/dist-packages (from torch<3,>=2.0->chronos-forecasting) (11.7.1.2)
Requirement already satisfied: nvidia-cusparse-cu12==12.5.4.2 in /usr/local/lib/python3.12/dist-packages (from torch<3,>=2.0->chronos-forecasting) (12.5.4.2)
Requirement already satisfied: nvidia-cusparselt-cu12==0.7.1 in /usr/local/lib/python3.12/dist-packages (from torch<3,>=2.0->chronos-forecasting) (0.7.1)
Requirement already satisfied: nvidia-nccl-cu12==2.27.3 in /usr/local/lib/python3.12/dist-packages (from torch<3,>=2.0->chronos-forecasting) (2.27.3)
Requirement already satisfied: nvidia-nvtx-cu12==12.6.77 in /usr/local/lib/python3.12/dist-packages (from torch<3,>=2.0->chronos-forecasting) (12.6.77)
Requirement already satisfied: nvidia-nvjitlink-cu12==12.6.85 in /usr/local/lib/python3.12/dist-packages (from torch<3,>=2.0->chronos-forecasting) (12.6.85)
Requirement already satisfied: nvidia-cufile-cu12==1.11.1.6 in /usr/local/lib/python3.12/dist-packages (from torch<3,>=2.0->chronos-forecasting) (1.11.1.6)
Requirement already satisfied: triton==3.4.0 in /usr/local/lib/python3.12/dist-packages (from torch<3,>=2.0->chronos-forecasting) (3.4.0)
Requirement already satisfied: regex!=2019.12.17 in /usr/local/lib/python3.12/dist-packages (from transformers<5,>=4.41->chronos-forecasting) (2024.11.6)
Requirement already satisfied: requests in /usr/local/lib/python3.12/dist-packages (from transformers<5,>=4.41->chronos-forecasting) (2.32.4)
Requirement already satisfied: tokenizers<=0.23.0,>=0.22.0 in /usr/local/lib/python3.12/dist-packages (from transformers<5,>=4.41->chronos-forecasting) (0.22.1)
Requirement already satisfied: tqdm>=4.27 in /usr/local/lib/python3.12/dist-packages (from transformers<5,>=4.41->chronos-forecasting) (4.67.1)
Collecting botocore<1.42.0,>=1.41.0 (from boto3->chronos-forecasting)
  Downloading botocore-1.41.0-py3-none-any.whl.metadata (5.9 kB)
Collecting jmespath<2.0.0,>=0.7.1 (from boto3->chronos-forecasting)
  Downloading jmespath-1.0.1-py3-none-any.whl.metadata (7.6 kB)
Collecting s3transfer<0.15.0,>=0.14.0 (from boto3->chronos-forecasting)
  Downloading s3transfer-0.14.0-py3-none-any.whl.metadata (1.7 kB)
Requirement already satisfied: python-dateutil<3.0.0,>=2.1 in /usr/local/lib/python3.12/dist-packages (from botocore<1.42.0,>=1.41.0->boto3->chronos-forecasting) (2.9.0.post0)
Requirement already satisfied: urllib3!=2.2.0,<3,>=1.25.4 in /usr/local/lib/python3.12/dist-packages (from botocore<1.42.0,>=1.41.0->boto3->chronos-forecasting) (2.5.0)
Requirement already satisfied: hf-xet<2.0.0,>=1.1.3 in /usr/local/lib/python3.12/dist-packages (from huggingface_hub>=0.21.0->accelerate<2,>=0.34->chronos-forecasting) (1.2.0)
Requirement already satisfied: mpmath<1.4,>=1.1.0 in /usr/local/lib/python3.12/dist-packages (from sympy>=1.13.3->torch<3,>=2.0->chronos-forecasting) (1.3.0)
Requirement already satisfied: MarkupSafe>=2.0 in /usr/local/lib/python3.12/dist-packages (from jinja2->torch<3,>=2.0->chronos-forecasting) (3.0.3)
Requirement already satisfied: charset_normalizer<4,>=2 in /usr/local/lib/python3.12/dist-packages (from requests->transformers<5,>=4.41->chronos-forecasting) (3.4.4)
Requirement already satisfied: idna<4,>=2.5 in /usr/local/lib/python3.12/dist-packages (from requests->transformers<5,>=4.41->chronos-forecasting) (3.11)
Requirement already satisfied: certifi>=2017.4.17 in /usr/local/lib/python3.12/dist-packages (from requests->transformers<5,>=4.41->chronos-forecasting) (2025.10.5)
Requirement already satisfied: six>=1.5 in /usr/local/lib/python3.12/dist-packages (from python-dateutil<3.0.0,>=2.1->botocore<1.42.0,>=1.41.0->boto3->chronos-forecasting) (1.17.0)
Downloading chronos_forecasting-2.0.1-py3-none-any.whl (67 kB)
   ━━━━━━━━━━━━━━━━━━━━━━━━━━━━━━━━━━━━━━━━ 67.3/67.3 kB 5.1 MB/s eta 0:00:00
?25hDownloading boto3-1.41.0-py3-none-any.whl (139 kB)
   ━━━━━━━━━━━━━━━━━━━━━━━━━━━━━━━━━━━━━━━━ 139.3/139.3 kB 10.6 MB/s eta 0:00:00
?25hDownloading botocore-1.41.0-py3-none-any.whl (14.2 MB)
   ━━━━━━━━━━━━━━━━━━━━━━━━━━━━━━━━━━━━━━━━ 14.2/14.2 MB 139.3 MB/s eta 0:00:00
?25hDownloading jmespath-1.0.1-py3-none-any.whl (20 kB)
Downloading s3transfer-0.14.0-py3-none-any.whl (85 kB)
   ━━━━━━━━━━━━━━━━━━━━━━━━━━━━━━━━━━━━━━━━ 85.7/85.7 kB 8.6 MB/s eta 0:00:00
?25hInstalling collected packages: jmespath, botocore, s3transfer, boto3, chronos-forecasting
Successfully installed boto3-1.41.0 botocore-1.41.0 chronos-forecasting-2.0.1 jmespath-1.0.1 s3transfer-0.14.0
CPU times: user 1.91 s, sys: 281 ms, total: 2.19 s
Wall time: 16.1 s
34.1. Set Up#
import pandas as pd  # requires: pip install pandas
import torch
from chronos import BaseChronosPipeline
import matplotlib.pyplot as plt  # requires: pip install matplotlib
import numpy as np

pipeline = BaseChronosPipeline.from_pretrained(
    "amazon/chronos-t5-small",  # use "amazon/chronos-bolt-small" for the corresponding Chronos-Bolt model
    device_map="cuda",  # use "cpu" for CPU inference
    torch_dtype=torch.bfloat16,
)
/usr/local/lib/python3.12/dist-packages/huggingface_hub/utils/_auth.py:94: UserWarning:
The secret `HF_TOKEN` does not exist in your Colab secrets.
To authenticate with the Hugging Face Hub, create a token in your settings tab (https://huggingface.co/settings/tokens), set it as secret in your Google Colab and restart your session.
You will be able to reuse this secret in all of your notebooks.
Please note that authentication is recommended but still optional to access public models or datasets.
  warnings.warn(
`torch_dtype` is deprecated! Use `dtype` instead!
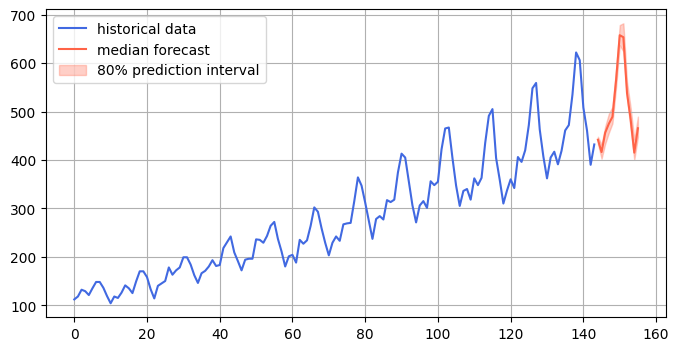
34.2. Forecasting Passenger Traffic#
df = pd.read_csv(
    "https://raw.githubusercontent.com/AileenNielsen/TimeSeriesAnalysisWithPython/master/data/AirPassengers.csv"
)

# context must be either a 1D tensor, a list of 1D tensors,
# or a left-padded 2D tensor with batch as the first dimension
# quantiles is an fp32 tensor with shape [batch_size, prediction_length, num_quantile_levels]
# mean is an fp32 tensor with shape [batch_size, prediction_length]
quantiles, mean = pipeline.predict_quantiles(
    inputs=torch.tensor(df["#Passengers"]),
    prediction_length=12,
    quantile_levels=[0.1, 0.5, 0.9],
)
df.head()
| Month | #Passengers | |
|---|---|---|
| 0 | 1949-01 | 112 |
| 1 | 1949-02 | 118 |
| 2 | 1949-03 | 132 |
| 3 | 1949-04 | 129 |
| 4 | 1949-05 | 121 |
df.tail()
| Month | #Passengers | |
|---|---|---|
| 139 | 1960-08 | 606 |
| 140 | 1960-09 | 508 |
| 141 | 1960-10 | 461 |
| 142 | 1960-11 | 390 |
| 143 | 1960-12 | 432 |
from chronos import ChronosPipeline, ChronosBoltPipeline

print(ChronosPipeline.predict.__doc__)  # for Chronos models
print(ChronosBoltPipeline.predict.__doc__)  # for Chronos-Bolt models
        Get forecasts for the given time series.

        Refer to the base method (``BaseChronosPipeline.predict``)
        for details on shared parameters.

        Additional parameters
        ---------------------
        num_samples
            Number of sample paths to predict. Defaults to what
            specified in ``self.model.config``.
        temperature
            Temperature to use for generating sample tokens.
            Defaults to what specified in ``self.model.config``.
        top_k
            Top-k parameter to use for generating sample tokens.
            Defaults to what specified in ``self.model.config``.
        top_p
            Top-p parameter to use for generating sample tokens.
            Defaults to what specified in ``self.model.config``.
        limit_prediction_length
            Force prediction length smaller or equal than the
            built-in prediction length from the model. False by
            default. When true, fail loudly if longer predictions
            are requested, otherwise longer predictions are allowed.

        Returns
        -------
        samples
            Tensor of sample forecasts, of shape
            (batch_size, num_samples, prediction_length).


        Get forecasts for the given time series.

        Refer to the base method (``BaseChronosPipeline.predict``)
        for details on shared parameters.
        Additional parameters
        ---------------------
        limit_prediction_length
            Force prediction length smaller or equal than the
            built-in prediction length from the model. False by
            default. When true, fail loudly if longer predictions
            are requested, otherwise longer predictions are allowed.

        Returns
        -------
        torch.Tensor
            Forecasts of shape (batch_size, num_quantiles, prediction_length)
            where num_quantiles is the number of quantiles the model has been
            trained to output. For official Chronos-Bolt models, the value of
            num_quantiles is 9 for [0.1, 0.2, ..., 0.9]-quantiles.

        Raises
        ------
        ValueError
            When limit_prediction_length is True and the prediction_length is
            greater than model's training prediction_length.
forecast_index = range(len(df), len(df) + 12)
low, median, high = quantiles[0, :, 0], quantiles[0, :, 1], quantiles[0, :, 2]

plt.figure(figsize=(8, 4))
plt.plot(df["#Passengers"], color="royalblue", label="historical data")
plt.plot(forecast_index, median, color="tomato", label="median forecast")
plt.fill_between(forecast_index, low, high, color="tomato", alpha=0.3, label="80% prediction interval")
plt.legend()
plt.grid()
plt.show()
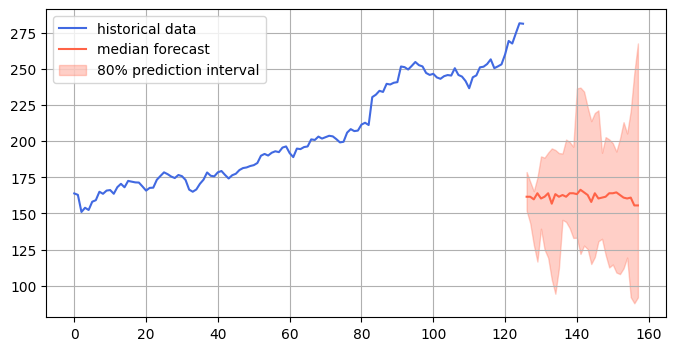
34.3. Forecasting Stock Prices#
# Code to use yfinance to download bitcoin data from FRED ticker CBBTCUSD

!pip install yfinance

import yfinance as yf
Requirement already satisfied: yfinance in /usr/local/lib/python3.12/dist-packages (0.2.66)
Requirement already satisfied: pandas>=1.3.0 in /usr/local/lib/python3.12/dist-packages (from yfinance) (2.2.2)
Requirement already satisfied: numpy>=1.16.5 in /usr/local/lib/python3.12/dist-packages (from yfinance) (2.0.2)
Requirement already satisfied: requests>=2.31 in /usr/local/lib/python3.12/dist-packages (from yfinance) (2.32.4)
Requirement already satisfied: multitasking>=0.0.7 in /usr/local/lib/python3.12/dist-packages (from yfinance) (0.0.12)
Requirement already satisfied: platformdirs>=2.0.0 in /usr/local/lib/python3.12/dist-packages (from yfinance) (4.5.0)
Requirement already satisfied: pytz>=2022.5 in /usr/local/lib/python3.12/dist-packages (from yfinance) (2025.2)
Requirement already satisfied: frozendict>=2.3.4 in /usr/local/lib/python3.12/dist-packages (from yfinance) (2.4.6)
Requirement already satisfied: peewee>=3.16.2 in /usr/local/lib/python3.12/dist-packages (from yfinance) (3.18.3)
Requirement already satisfied: beautifulsoup4>=4.11.1 in /usr/local/lib/python3.12/dist-packages (from yfinance) (4.13.5)
Requirement already satisfied: curl_cffi>=0.7 in /usr/local/lib/python3.12/dist-packages (from yfinance) (0.13.0)
Requirement already satisfied: protobuf>=3.19.0 in /usr/local/lib/python3.12/dist-packages (from yfinance) (5.29.5)
Requirement already satisfied: websockets>=13.0 in /usr/local/lib/python3.12/dist-packages (from yfinance) (15.0.1)
Requirement already satisfied: soupsieve>1.2 in /usr/local/lib/python3.12/dist-packages (from beautifulsoup4>=4.11.1->yfinance) (2.8)
Requirement already satisfied: typing-extensions>=4.0.0 in /usr/local/lib/python3.12/dist-packages (from beautifulsoup4>=4.11.1->yfinance) (4.15.0)
Requirement already satisfied: cffi>=1.12.0 in /usr/local/lib/python3.12/dist-packages (from curl_cffi>=0.7->yfinance) (2.0.0)
Requirement already satisfied: certifi>=2024.2.2 in /usr/local/lib/python3.12/dist-packages (from curl_cffi>=0.7->yfinance) (2025.10.5)
Requirement already satisfied: python-dateutil>=2.8.2 in /usr/local/lib/python3.12/dist-packages (from pandas>=1.3.0->yfinance) (2.9.0.post0)
Requirement already satisfied: tzdata>=2022.7 in /usr/local/lib/python3.12/dist-packages (from pandas>=1.3.0->yfinance) (2025.2)
Requirement already satisfied: charset_normalizer<4,>=2 in /usr/local/lib/python3.12/dist-packages (from requests>=2.31->yfinance) (3.4.4)
Requirement already satisfied: idna<4,>=2.5 in /usr/local/lib/python3.12/dist-packages (from requests>=2.31->yfinance) (3.11)
Requirement already satisfied: urllib3<3,>=1.21.1 in /usr/local/lib/python3.12/dist-packages (from requests>=2.31->yfinance) (2.5.0)
Requirement already satisfied: pycparser in /usr/local/lib/python3.12/dist-packages (from cffi>=1.12.0->curl_cffi>=0.7->yfinance) (2.23)
Requirement already satisfied: six>=1.5 in /usr/local/lib/python3.12/dist-packages (from python-dateutil>=2.8.2->pandas>=1.3.0->yfinance) (1.17.0)
# Download Stock data
df = yf.download("GOOGL", start="2023-08-31", end="2025-11-01")

# Print the downloaded data
df.head()
/tmp/ipython-input-375105660.py:2: FutureWarning: YF.download() has changed argument auto_adjust default to True
  df = yf.download("GOOGL", start="2023-08-31", end="2025-11-01")
[*********************100%***********************]  1 of 1 completed
| Price | Close | High | Low | Open | Volume |
|---|---|---|---|---|---|
| Ticker | GOOGL | GOOGL | GOOGL | GOOGL | GOOGL |
| Date | |||||
| 2023-08-31 | 135.237244 | 137.054710 | 134.859842 | 135.078336 | 30053800 |
| 2023-09-01 | 134.730743 | 136.518417 | 133.926294 | 136.518417 | 21543700 |
| 2023-09-05 | 134.840012 | 135.485553 | 133.658160 | 134.512270 | 19403100 |
| 2023-09-06 | 133.538971 | 135.594784 | 132.754374 | 135.088283 | 18684500 |
| 2023-09-07 | 134.333481 | 134.651296 | 132.039306 | 132.674922 | 18844300 |
f_len = 32
col_name = 'Close'

quantiles, mean = pipeline.predict_quantiles(
    inputs=torch.tensor(df[col_name].dropna().values[-126:]), # Convert the Pandas Series to a NumPy array and drop NaN values before creating the tensor
    prediction_length=f_len,
    quantile_levels=[0.1, 0.5, 0.9],
)
forecast_index = range(len(df[-126:]), len(df[-126:]) + f_len)
low, median, high = quantiles[0, :, 0], quantiles[0, :, 1], quantiles[0, :, 2]

plt.figure(figsize=(8, 4))
plt.plot(np.array(df[col_name][-126:]), color="royalblue", label="historical data")
plt.plot(forecast_index, median, color="tomato", label="median forecast")
plt.fill_between(forecast_index, low, high, color="tomato", alpha=0.3, label="80% prediction interval")
plt.legend()
plt.grid()
plt.show()
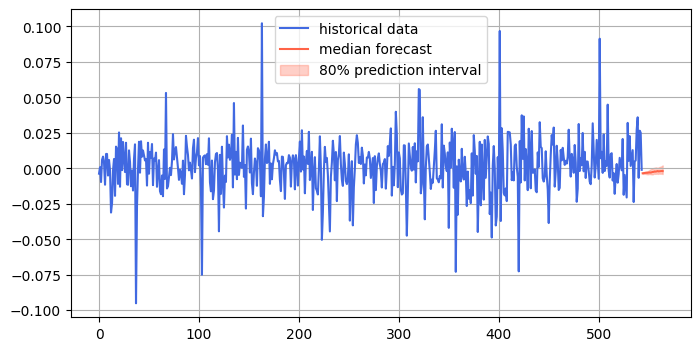
34.4. Stock Returns#
f_len = 21
col_name = 'Close'
ts = df[col_name].pct_change().dropna().values

quantiles, mean = pipeline.predict_quantiles(
    inputs=torch.tensor(ts), # Convert the Pandas Series to a NumPy array and drop NaN values before creating the tensor
    prediction_length=f_len,
    quantile_levels=[0.1, 0.5, 0.9],
)
forecast_index = range(len(ts), len(ts) + f_len)
low, median, high = quantiles[0, :, 0], quantiles[0, :, 1], quantiles[0, :, 2]

plt.figure(figsize=(8, 4))
plt.plot(np.array(ts), color="royalblue", label="historical data")
plt.plot(forecast_index, median, color="tomato", label="median forecast")
plt.fill_between(forecast_index, low, high, color="tomato", alpha=0.3, label="80% prediction interval")
plt.legend()
plt.grid()
plt.show()
34.5. Treasuries (10 yr)#
df = pd.read_csv('https://fred.stlouisfed.org/graph/fredgraph.csv?bgcolor=%23ebf3fb&chart_type=line&drp=0&fo=open%20sans&graph_bgcolor=%23ffffff&height=450&mode=fred&recession_bars=on&txtcolor=%23444444&ts=12&tts=12&width=1320&nt=0&thu=0&trc=0&show_legend=yes&show_axis_titles=yes&show_tooltip=yes&id=DFII10&scale=left&cosd=2020-03-20&coed=2025-03-20&line_color=%230073e6&link_values=false&line_style=solid&mark_type=none&mw=3&lw=3&ost=-99999&oet=99999&mma=0&fml=a&fq=Daily&fam=avg&fgst=lin&fgsnd=2020-02-01&line_index=1&transformation=lin&vintage_date=2025-03-21&revision_date=2025-03-21&nd=2003-01-02')
df.head()
| observation_date | DFII10 | |
|---|---|---|
| 0 | 2020-03-20 | 0.17 |
| 1 | 2020-03-23 | -0.04 |
| 2 | 2020-03-24 | -0.13 |
| 3 | 2020-03-25 | -0.19 |
| 4 | 2020-03-26 | -0.24 |
f_len = 64
col_name = 'DFII10'

quantiles, mean = pipeline.predict_quantiles(
    inputs=torch.tensor(df[col_name].dropna().values), # Convert the Pandas Series to a NumPy array and drop NaN values before creating the tensor
    prediction_length=f_len,
    quantile_levels=[0.1, 0.5, 0.9],
)
forecast_index = range(len(df), len(df) + f_len)
low, median, high = quantiles[0, :, 0], quantiles[0, :, 1], quantiles[0, :, 2]

plt.figure(figsize=(8, 4))
plt.plot(np.array(df[col_name]), color="royalblue", label="historical data")
plt.plot(forecast_index, median, color="tomato", label="median forecast")
plt.fill_between(forecast_index, low, high, color="tomato", alpha=0.3, label="80% prediction interval")
plt.legend()
plt.grid()
plt.show()
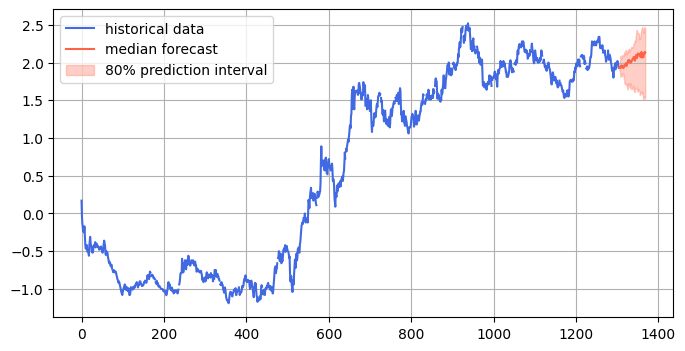
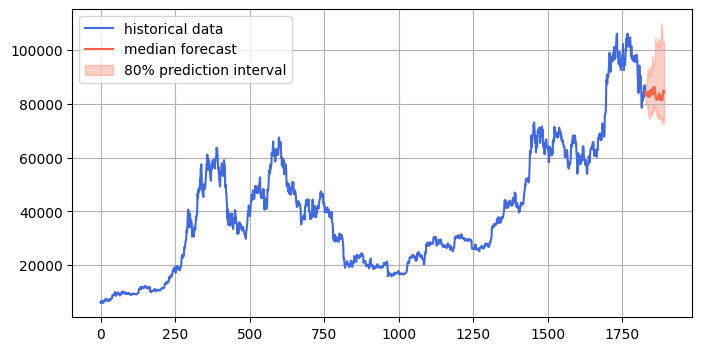
34.6. Cryptocurrencies#
df = pd.read_csv('https://fred.stlouisfed.org/graph/fredgraph.csv?bgcolor=%23ebf3fb&chart_type=line&drp=0&fo=open%20sans&graph_bgcolor=%23ffffff&height=450&mode=fred&recession_bars=on&txtcolor=%23444444&ts=12&tts=12&width=1320&nt=0&thu=0&trc=0&show_legend=yes&show_axis_titles=yes&show_tooltip=yes&id=CBBTCUSD&scale=left&cosd=2020-03-20&coed=2025-03-20&line_color=%230073e6&link_values=false&line_style=solid&mark_type=none&mw=3&lw=3&ost=-99999&oet=99999&mma=0&fml=a&fq=Daily%2C%207-Day&fam=avg&fgst=lin&fgsnd=2020-02-01&line_index=1&transformation=lin&vintage_date=2025-03-21&revision_date=2025-03-21&nd=2014-12-01')
df.head()
| observation_date | CBBTCUSD | |
|---|---|---|
| 0 | 2020-03-20 | 6215.40 |
| 1 | 2020-03-21 | 6168.72 |
| 2 | 2020-03-22 | 5791.69 |
| 3 | 2020-03-23 | 6583.38 |
| 4 | 2020-03-24 | 6742.21 |
f_len = 64
col_name = 'CBBTCUSD'

quantiles, mean = pipeline.predict_quantiles(
    inputs=torch.tensor(df[col_name].dropna().values), # Convert the Pandas Series to a NumPy array and drop NaN values before creating the tensor
    prediction_length=f_len,
    quantile_levels=[0.1, 0.5, 0.9],
)
forecast_index = range(len(df), len(df) + f_len)
low, median, high = quantiles[0, :, 0], quantiles[0, :, 1], quantiles[0, :, 2]

plt.figure(figsize=(8, 4))
plt.plot(np.array(df[col_name]), color="royalblue", label="historical data")
plt.plot(forecast_index, median, color="tomato", label="median forecast")
plt.fill_between(forecast_index, low, high, color="tomato", alpha=0.3, label="80% prediction interval")
plt.legend()
plt.grid()
plt.show()
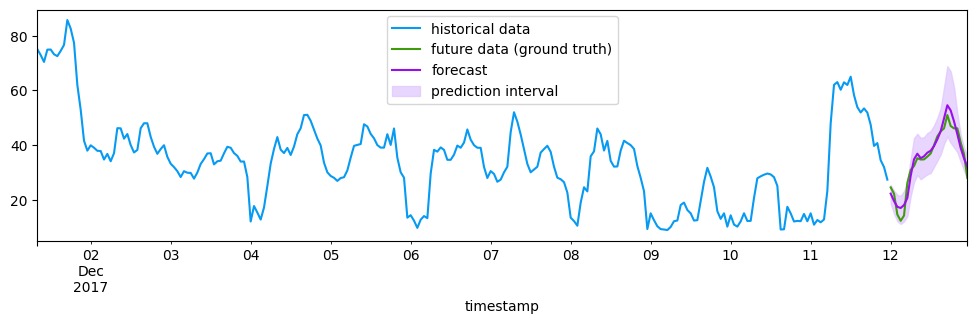
34.7. Chronos-2#
This is for multivariate forecasting. See the technical paper: https://arxiv.org/abs/2510.15821
GitHub: amazon-science/chronos-forecasting
Let’s try the example provided:
import pandas as pd  # requires: pip install 'pandas[pyarrow]'
from chronos import Chronos2Pipeline

pipeline = Chronos2Pipeline.from_pretrained("amazon/chronos-2", device_map="cuda")

# Load historical target values and past values of covariates
context_df = pd.read_parquet("https://autogluon.s3.amazonaws.com/datasets/timeseries/electricity_price/train.parquet")

# (Optional) Load future values of covariates
test_df = pd.read_parquet("https://autogluon.s3.amazonaws.com/datasets/timeseries/electricity_price/test.parquet")
future_df = test_df.drop(columns="target")

# Generate predictions with covariates
pred_df = pipeline.predict_df(
    context_df,
    future_df=future_df,
    prediction_length=24,  # Number of steps to forecast
    quantile_levels=[0.1, 0.5, 0.9],  # Quantile for probabilistic forecast
    id_column="id",  # Column identifying different time series
    timestamp_column="timestamp",  # Column with datetime information
    target="target",  # Column(s) with time series values to predict
)
context_df.head()
| id | timestamp | target | Ampirion Load Forecast | PV+Wind Forecast | |
|---|---|---|---|---|---|
| 0 | DE | 2012-01-09 00:00:00 | 34.970001 | 16382.00 | 3569.527588 |
| 1 | DE | 2012-01-09 01:00:00 | 33.430000 | 15410.50 | 3315.274902 |
| 2 | DE | 2012-01-09 02:00:00 | 32.740002 | 15595.00 | 3107.307617 |
| 3 | DE | 2012-01-09 03:00:00 | 32.459999 | 16521.00 | 2944.620117 |
| 4 | DE | 2012-01-09 04:00:00 | 32.500000 | 17700.75 | 2897.149902 |
import matplotlib.pyplot as plt  # requires: pip install matplotlib

ts_context = context_df.set_index("timestamp")["target"].tail(256)
ts_pred = pred_df.set_index("timestamp")
ts_ground_truth = test_df.set_index("timestamp")["target"]

ts_context.plot(label="historical data", color="xkcd:azure", figsize=(12, 3))
ts_ground_truth.plot(label="future data (ground truth)", color="xkcd:grass green")
ts_pred["predictions"].plot(label="forecast", color="xkcd:violet")
plt.fill_between(
    ts_pred.index,
    ts_pred["0.1"],
    ts_pred["0.9"],
    alpha=0.7,
    label="prediction interval",
    color="xkcd:light lavender",
)
plt.legend()
<matplotlib.legend.Legend at 0x7a2c41d253a0>
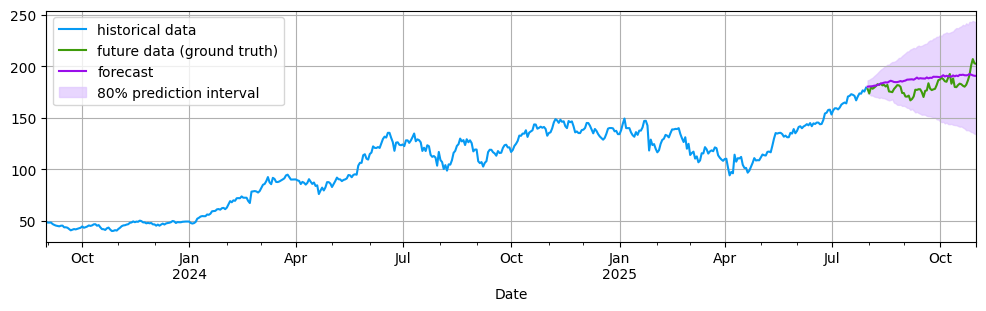
34.8. Compare to univariate forecast#
Drop all additional data and only keep the target series.
context_df = context_df[["id", "timestamp", "target"]]
test_df = test_df[["id", "timestamp", "target"]]
future_df = test_df.drop(columns="target")
pred_df = pipeline.predict_df(
    context_df,
    future_df=future_df,
    prediction_length=24,  # Number of steps to forecast
    quantile_levels=[0.1, 0.5, 0.9],  # Quantile for probabilistic forecast
    id_column="id",  # Column identifying different time series
    timestamp_column="timestamp",  # Column with datetime information
    target="target",  # Column(s) with time series values to predict
)
ts_context = context_df.set_index("timestamp")["target"].tail(256)
ts_pred = pred_df.set_index("timestamp")
ts_ground_truth = test_df.set_index("timestamp")["target"]

ts_context.plot(label="historical data", color="xkcd:azure", figsize=(12, 3))
ts_ground_truth.plot(label="future data (ground truth)", color="xkcd:grass green")
ts_pred["predictions"].plot(label="forecast", color="xkcd:violet")
plt.fill_between(
    ts_pred.index,
    ts_pred["0.1"],
    ts_pred["0.9"],
    alpha=0.7,
    label="prediction interval",
    color="xkcd:light lavender",
)
plt.legend()
<matplotlib.legend.Legend at 0x7a2d4ee75e80>
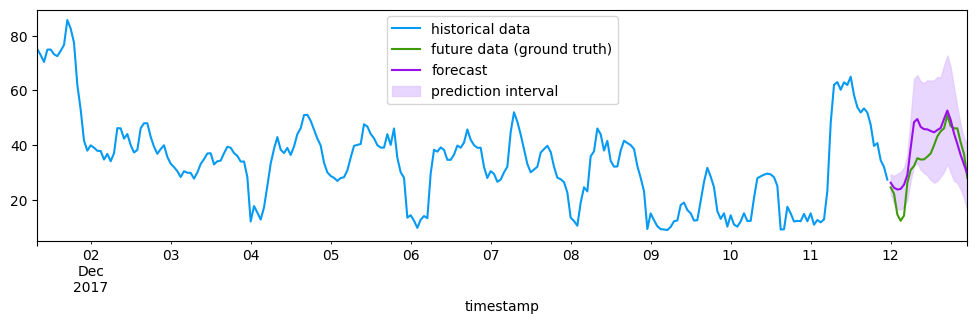
We can see that the forecast error is much higher.
34.9. Multivariate stock price forecast#
We download the “magnificent 7” tech stocks: Alphabet, Amazon, Apple, Microsoft, Netflix, Nvidia, Tesla.
df = yf.download(["GOOGL", "AMZN", "AAPL", "MSFT", "NFLX", "NVDA", "TSLA"],
                  start="2023-08-31", end="2025-11-01")
/tmp/ipython-input-1245906998.py:1: FutureWarning: YF.download() has changed argument auto_adjust default to True
  df = yf.download(["GOOGL", "AMZN", "AAPL", "MSFT", "NFLX", "NVDA", "TSLA"],
[*********************100%***********************]  7 of 7 completed
df.head()
| Price | Close | High | ... | Open | Volume | ||||||||||||||||
|---|---|---|---|---|---|---|---|---|---|---|---|---|---|---|---|---|---|---|---|---|---|
| Ticker | AAPL | AMZN | GOOGL | MSFT | NFLX | NVDA | TSLA | AAPL | AMZN | GOOGL | ... | NFLX | NVDA | TSLA | AAPL | AMZN | GOOGL | MSFT | NFLX | NVDA | TSLA |
| Date | |||||||||||||||||||||
| 2023-08-31 | 185.867477 | 138.009995 | 135.237244 | 322.894012 | 43.368000 | 49.321865 | 258.079987 | 187.104154 | 138.789993 | 137.054710 | ... | 43.123001 | 49.346850 | 255.979996 | 60794500 | 58781300 | 30053800 | 26411000 | 38030000 | 528570000 | 108861700 |
| 2023-09-01 | 187.440536 | 138.119995 | 134.730759 | 323.780640 | 43.987999 | 48.476433 | 245.009995 | 187.895625 | 139.960007 | 136.518432 | ... | 43.772999 | 49.728594 | 257.260010 | 45766500 | 40991500 | 21543700 | 14942000 | 47934000 | 463830000 | 132541600 |
| 2023-09-05 | 187.677979 | 137.270004 | 134.839981 | 328.597992 | 44.868000 | 48.515415 | 256.489990 | 187.954993 | 137.800003 | 135.485523 | ... | 43.839001 | 48.190633 | 245.000000 | 45280000 | 40636700 | 19403100 | 18553900 | 61559000 | 382653000 | 129469600 |
| 2023-09-06 | 180.960388 | 135.360001 | 133.538986 | 327.937988 | 44.576000 | 47.033283 | 251.919998 | 186.837077 | 137.449997 | 135.594799 | ... | 44.861000 | 48.412472 | 255.139999 | 81755800 | 41785500 | 18684500 | 17535800 | 38623000 | 468670000 | 116959800 |
| 2023-09-07 | 175.667374 | 137.850006 | 134.333496 | 325.012085 | 44.313999 | 46.213760 | 251.490005 | 176.310454 | 138.029999 | 134.651311 | ... | 44.115002 | 45.498183 | 245.070007 | 112488800 | 48498900 | 18844300 | 18381000 | 29227000 | 433330000 | 115312900 |
5 rows × 35 columns
df1 = df["Close"].reset_index()
print("Length of series =", len(df))
df1["item_id"] = "D1"

# Convert 'Date' to datetime and set it as index
df1['Date'] = pd.to_datetime(df1['Date'])
df1 = df1.set_index('Date')

# Reindex to business day frequency and forward-fill missing values
df1 = df1.asfreq('B').ffill()

# Reset index to make 'Date' a column again, as predict_df expects it
df1 = df1.reset_index()

df1.head()
Length of series = 545
| Ticker | Date | AAPL | AMZN | GOOGL | MSFT | NFLX | NVDA | TSLA | item_id |
|---|---|---|---|---|---|---|---|---|---|
| 0 | 2023-08-31 | 185.867477 | 138.009995 | 135.237244 | 322.894012 | 43.368000 | 49.321865 | 258.079987 | D1 |
| 1 | 2023-09-01 | 187.440536 | 138.119995 | 134.730759 | 323.780640 | 43.987999 | 48.476433 | 245.009995 | D1 |
| 2 | 2023-09-04 | 187.440536 | 138.119995 | 134.730759 | 323.780640 | 43.987999 | 48.476433 | 245.009995 | D1 |
| 3 | 2023-09-05 | 187.677979 | 137.270004 | 134.839981 | 328.597992 | 44.868000 | 48.515415 | 256.489990 | D1 |
| 4 | 2023-09-06 | 180.960388 | 135.360001 | 133.538986 | 327.937988 | 44.576000 | 47.033283 | 251.919998 | D1 |
import pandas as pd  # requires: pip install 'pandas[pyarrow]'
from chronos import Chronos2Pipeline

pipeline = Chronos2Pipeline.from_pretrained("amazon/chronos-2", device_map="cuda")

# Load historical target values and past values of covariates
context_df = df1.iloc[:500]

# (Optional) Load future values of covariates
test_df = df1.iloc[500:]
future_df = test_df.drop(columns=["NVDA"]) # Only drop the target column, keep 'item_id'
pred_length = len(test_df)

# Generate predictions with covariates
pred_df = pipeline.predict_df(
    context_df,
    future_df=future_df,
    prediction_length=pred_length,  # Number of steps to forecast
    quantile_levels=[0.1, 0.5, 0.9],  # Quantile for probabilistic forecast
    id_column="item_id",  # Column identifying different time series
    timestamp_column="Date",  # Column with datetime information
    target="NVDA",  # Column(s) with time series values to predict
)
import matplotlib.pyplot as plt

ts_context = context_df.set_index("Date")["NVDA"]
ts_pred = pred_df.set_index("Date")
ts_ground_truth = test_df.set_index("Date")["NVDA"]

plt.figure(figsize=(12, 3))
ts_context.plot(label="historical data", color="royalblue")
ts_ground_truth.plot(label="future data (ground truth)", color="green")
ts_pred["predictions"].plot(label="forecast", color="tomato")
plt.fill_between(
    ts_pred.index,
    ts_pred["0.1"], # Using '0.1' as the lower quantile column name
    ts_pred["0.9"], # Using '0.9' as the upper quantile column name
    alpha=0.3,
    label="80% prediction interval",
    color="orange",
)
plt.title("Multivariate NVDA Stock Price Forecast")
plt.xlabel("Date")
plt.ylabel("Stock Price (NVDA)")
plt.legend()
plt.grid(True)
plt.show()
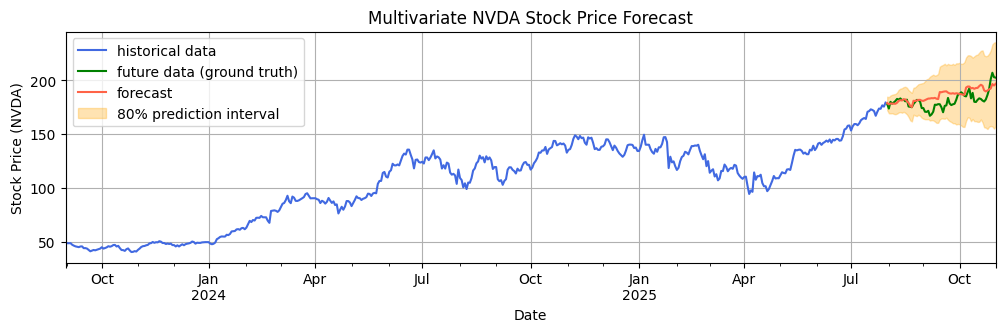
print("Mean Absolute Percentage Error (MAPE) =", (abs(ts_ground_truth - ts_pred["predictions"]) / ts_ground_truth).mean())
print("Root Mean Squared Error (RMSE) =", ((ts_ground_truth - ts_pred["predictions"]) ** 2).mean() ** 0.5)
Mean Absolute Percentage Error (MAPE) = 0.03533941370091254
Root Mean Squared Error (RMSE) = 8.092790535852734
# Univariate forecast?
context_df = context_df[["item_id", "Date", "NVDA"]]
test_df = test_df[["item_id", "Date", "NVDA"]]
future_df = test_df.drop(columns="NVDA")
pred_df = pipeline.predict_df(
    context_df,
    future_df=future_df,
    prediction_length=pred_length,  # Number of steps to forecast
    quantile_levels=[0.1, 0.5, 0.9],  # Quantile for probabilistic forecast
    id_column="item_id",  # Column identifying different time series
    timestamp_column="Date",  # Column with datetime information
    target="NVDA",  # Column(s) with time series values to predict
)
ts_context = context_df.set_index("Date")["NVDA"]
ts_pred = pred_df.set_index("Date")
ts_ground_truth = test_df.set_index("Date")["NVDA"]

ts_context.plot(label="historical data", color="xkcd:azure", figsize=(12, 3))
ts_ground_truth.plot(label="future data (ground truth)", color="xkcd:grass green")
ts_pred["predictions"].plot(label="forecast", color="xkcd:violet")
plt.fill_between(
    ts_pred.index,
    ts_pred["0.1"],
    ts_pred["0.9"],
    alpha=0.7,
    label="80% prediction interval",
    color="xkcd:light lavender",
)
plt.legend()
plt.grid()
print("Mean Absolute Percentage Error (MAPE) =", (abs(ts_ground_truth - ts_pred["predictions"]) / ts_ground_truth).mean())
print("Root Mean Squared Error (RMSE) =", ((ts_ground_truth - ts_pred["predictions"]) ** 2).mean() ** 0.5)
Mean Absolute Percentage Error (MAPE) = 0.044511327754015645
Root Mean Squared Error (RMSE) = 9.512994695115095